In-house product · Web · iOS
Netzfrequenz.App.
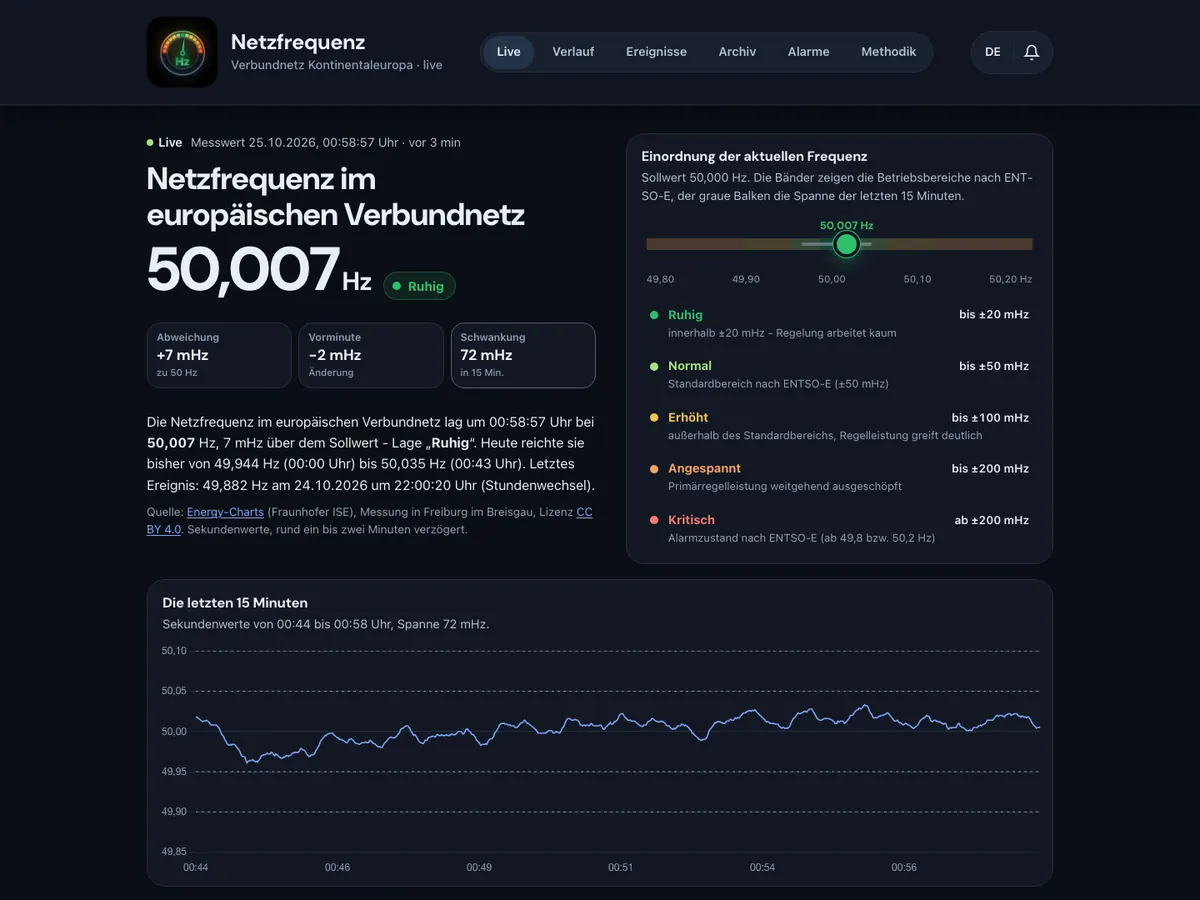
Live monitor of the grid frequency in the European interconnected grid: per-second values from Energy-Charts (Fraunhofer ISE), classification based on ENTSO-E, daily curve, events from 100 mHz, push alerts, daily archive with CSV - 26 languages.
- Type
- In-house product
- Disciplines
- Web · iOS
- Devices
- iPhone · iPad · iPhone Duo
- Status
- Live
- Website
- netzfrequenz.app ↗
Challenge
The grid frequency is a direct indicator of the stability of the European interconnected grid. It changes every second - a clear live view was missing.
Approach
Netzfrequenz.App shows per-second values from Energy-Charts (Fraunhofer ISE) and classifies them based on ENTSO-E. It adds a daily curve, a list of events with a deviation of 100 mHz or more, and push alerts.
- Live per-second values, classified based on ENTSO-E
- Daily curve and events from 100 mHz
- Push alerts and daily archive with CSV export
- 26 languages, web and iOS
Outcome
A live monitor that makes a technical measurement readable for everyone.